Who are the main users of business intelligence financial analytics?
Business leaders and owners
It is important for CEOs and business owners to see the overall financial performance of the company so that they can immediately see the results of operations, trends and even potential risks. Reports designed for managers help to make timely business decisions and successfully manage the company without wasting time.
Heads of company departments and senior specialists
For this group of employees, reports are developed in much more detail, which allows you to expand the data from the general reports and receive specific and detailed reports necessary for daily work, planning or monitoring. This group includes sales managers, production managers, warehouse managers, HR specialists and marketing specialists. Individual reports are developed for each group of specialists in order to be able to quickly receive the necessary information and monitor the progress of work.
For finance executives
Financial managers, chief accountants, and data analysts can quickly and easily receive regular financial reports, reports in various data sections, and quickly spot errors and inconsistencies in accounting data using business intelligence reports. These reports save time and money by eliminating the need to hire countless staff to manually prepare the required reports.
For what purposes can we use Business Intelligence in Power BI?
- Management reports
- To plan and control the execution of the plan
- For operational daily work
- To inform employees
- To identify errors and inaccuracies
Power BI Interactive Reporting Platform (Business Intelligence)
Financial analysis and management interactive reports for modern companies that assess the importance and necessity of timely financial data for business development and profit.
Company management must make decisions on a daily basis, so it is important that the data is timely and accurate.
We offer to develop management reports according to the type of your business on the Power BI platform, so that you can make important business decisions in a timely manner.
On the Power BI platform, we can prepare sales statistics, inventory statistics, financial analytics or other reports as needed by the company.
Business intelligence tools allow you to create multi-dimensional, in-depth, visually easy-to-understand reports and understand what's going on in your company in minutes.
Power BI is a powerful and modern analytics for your business. You will no longer have to wait for the accountant to prepare the necessary reports, as you will be able to monitor your company's performance on the Power BI platform on a daily basis.
Key benefits of using the Power BI business intelligence tool.
- Efficiency - data is updated automatically, without employee involvement
- Save time - get the reports you want with one click
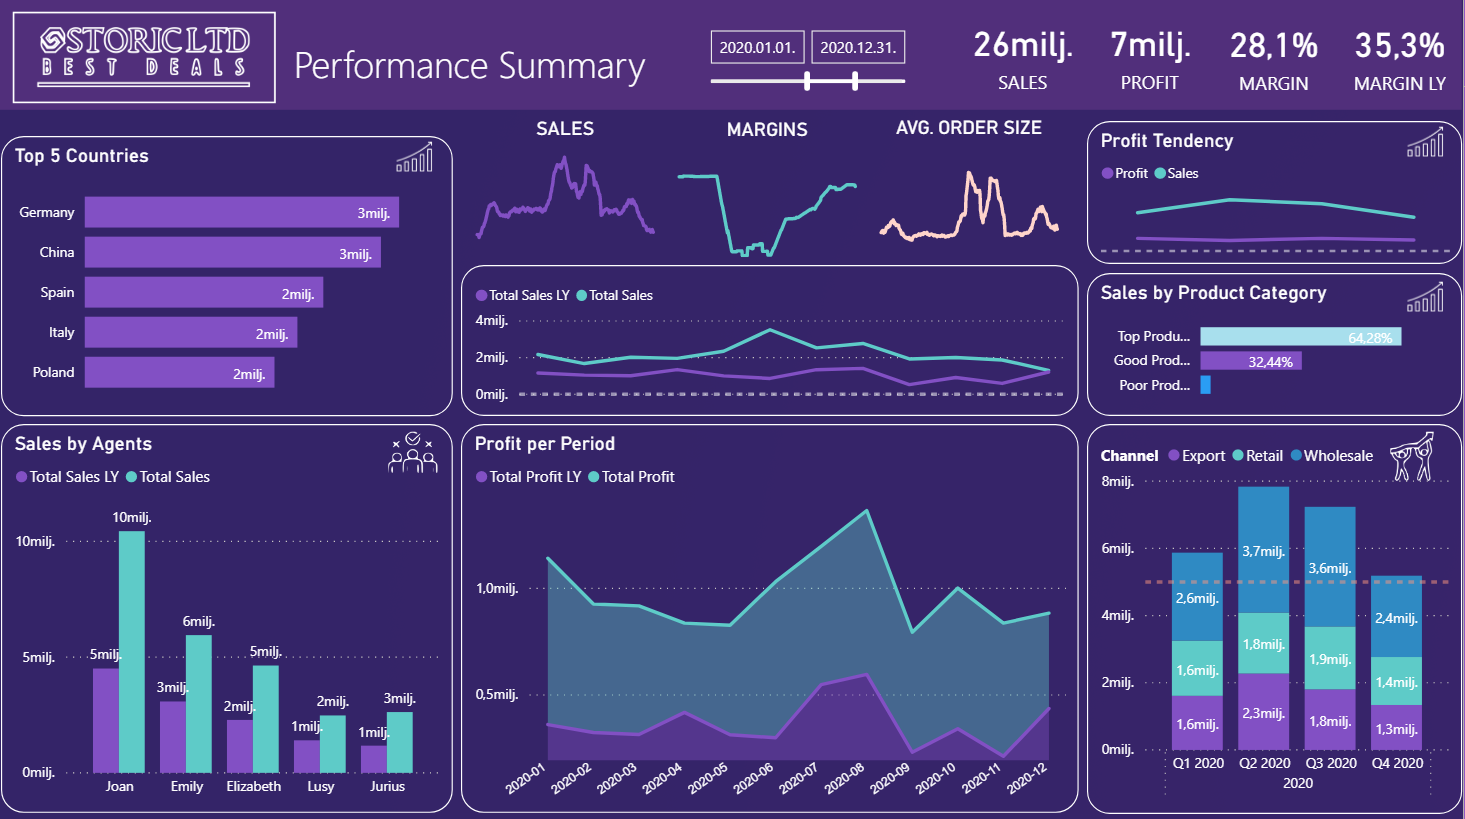
Power BI Report - Profit or Loss Report provides an interactive way to navigate by year, quarter, month, and different data sections. In addition, the main indicators of the company's activities are calculated - turnover, net profit, gross profitability and net profitability. Visually easy to understand and very useful report for monitoring trends and development of the company as a whole. In order to notice the negative trends in economic activity in time and be able to respond in time to the processes in general. The observed positive trends in economic activity allow companies to develop in the direction where the conditions for the development and profit of the company are more favorable.
Example # 2 - Power BI financial reporting
Balance sheet and income statement. These reports can be printed out for submission to government agencies and banks.
Income statement analysis.
Here you can visually see at a glance whether the performance has improved or worsened compared to the previous reporting period. The red, green, and yellow icons visually indicate where to look.
The report calculates the most important economic indicators. Turnover, margin,% margin, profit margin and net profit. Accordingly, we also see comparative figures from the previous reporting period.
Balance sheet analysis provides information on key financial indicators. The report calculates net current assets, liquidity ratios, as well as the financial independence ratio and the total liability ratio.
Balance provides an interactive way to navigate through years and different sections of data. Visually easy to understand and very useful report for monitoring trends and development of the company as a whole.
Example # 3: Financial Modeling
Income analysis and financial modeling tools. Detailed information on revenues and profits by product category, groups, suppliers and retail chains. Reports and visual income statement by month, and profit and loss statement by month.
Financial modeling tool, where, by changing the criteria you will immediately receive complete information about the planned reporting period and the amount of profit.
Financial modeling helps you understand the patterns between profits and influencing factors such as sales prices, purchase prices, fixed and variable costs.
This interactive and visual tool immediately shows how changes affect profit.Very good assistant at the stage of budgeting in order to get the desired result accordingly. When the indicator changes, we immediately see the result both visually (the sun means growth and, accordingly, profit), and in the corresponding articles of the profit and loss statement.
Example # 4: Sales report
The sales report provides general information on the results for the reporting period, general performance, trends and structure. When you select a specific option, we immediately receive a filtered report based on our selection criteria. For example, when we tag a specific seller, we immediately receive all the information filtered by that seller. We can see product categories, retailers, customers, countries, total mark-up and sales profit. From each visual section, we can drill down on the data to get the information we need. This is just one example of how we can design a sales report. These reports are very good for tracking budget execution by each salesperson and the company as a whole.